Nurturing Sustainability: Raising Power Consumption Awareness
Supervisors: Diana Gaponcic, Ricardo Rocha
With modern society relying more and more on digital services this has led to an explosive growth in data centres and cloud-based applications. This growth comes at a cost – data centres are power-hungry and contribute significantly to carbon emissions. To address this, multiple efforts and projects have been looking at integrating sustainability practices in all tech areas, including containers and clusters.
As part of my summer internship with CERN openlab i had the chance to join the CERN Kubernetes team to try out some of these tools, and hopefully launch the first steps to integrate them with the CERN infrastructure.
While having fun, travelling, and making new friends at the same time…
This blog post focuses on finding ways to populate power consumption metrics and visualize them in meaningful ways. It should help raise awareness and find ways to minimize the carbon footprint without compromising application efficiency.
In this blog post, we use Kepler to estimate the power consumption. While this project is obviously a good choice due to its active open-source community, multiple installation ways, and various well-documented metrics, there are some other promising projects in the ecosystem worth trying out.
Kepler Architecture
Kepler (Kubernetes Efficient Power Level Exporter) is an open-source project that uses eBPF to probe CPU performance counters and Linux kernel tracepoints. This data can then be put against actual energy consumption readings or fed to a machine learning model to estimate energy consumption, especially when working with VMs where this information is not available from the hypervisor. The metrics are exported to Prometheus and can be integrated as part of the monitoring. An overview of the architecture can be seen below:

Source: github.com/sustainable-computing-io/kepler-model-server
Kepler Exporter
The Kepler Exporter is a crucial component responsible for exposing the metrics related to energy consumption from different Kubernetes components like Pods and Nodes.

Source: github.com/sustainable-computing-io/kepler
- The Kepler Exporter collects energy consumption metrics from Kubernetes components such as Pods and Nodes using eBPF.
- The metrics are available in Prometheus and be be visualized with Grafana.
- Later, the metrics could be utilized to make scheduling decisions to optimeze the power consumption.
To find more about eBPF in Kepler consult the documentation.
Kepler Model Server
The Kepler Model Server plays a central role in the Kepler architecture. It is designed to provide power estimation models based on various parameters and requests. These models estimate power consumption based on factors like target granularity, available input metrics, and model filters.
- The Kepler Model Server receives requests from clients, which include details about the target granularity (e.g., node, pod), available input metrics, and model filters.
- Based on these requests, the server selects an appropriate power estimation model.
- The Kepler Estimator, which is a client module, interacts with the Kepler Model Server as a sidecar of the Kepler Exporter’s main container. It serves PowerRequests by utilizing the model package defined in Kepler Exporter’s estimator.go file via a unix domain socket.
There is also the possibility of deploying an online-trainer. It runs as a sidecar to the main server, and executes training pipelines to update the power estimation model in real-time when new power metrics become available.
Kepler Estimator
The Kepler Estimator serves as a client module to the Kepler Model Server, running as a sidecar of the Kepler Exporter’s main container. It handles PowerRequests and interacts with the power estimation models to provide power consumption estimates.
- The Kepler Estimator acts as a client module to the Kepler Model Server.
- It receives PowerRequests from the model package in the Kepler Exporter via a unix domain socket (/tmp/estimator.sock).
- The Kepler Estimator uses the power estimation models available in the Kepler Model Server to calculate power consumption estimates based on the provided parameters.
- These estimates are then available to the Kepler Exporter.
Installation
The project was designed to be easily installed, and provides multiple ways to do so:
- using an existing helm chart
- building manifests with make
- using the Kepler operator
We tried all installation options. While all methods should work out of the box, we encountered a few issues and settled on building the manifests using make. The command used is:
make build-manifest OPTS="PROMETHEUS_DEPLOY ESTIMATOR_SIDECAR_DEPLOY MODEL_SERVER_DEPLOY"
More configuration options can be found in the documentation.
Running the command above and applying the resulting manifests deploys an exporter (with the estimator as a sidecar) on each node, and the model server:
$ kubectl get pod -n kepler
NAME                                   READY   STATUS    RESTARTS   AGE
kepler-exporter-8t6tb                  2/2     Running   0          18h
kepler-exporter-bsmmj                  2/2     Running   0          18h
kepler-exporter-k4dtb                  2/2     Running   0          18h
kepler-model-server-68df498948-zfblr   1/1     Running   0          19h
Kepler projects provides a Grafana dashboard to visualize the metrics.
While the pods were running successfully, no data was available in Prometheus. This lead to some further investigations.
Issue 1: different number of headers and values in the request
The Kepler Estimator module receives a request from the exporter similar to:
"cpu_time","irq_net_tx","irq_net_rx","irq_block","cgroupfs_memory_usage_bytes",
"cgroupfs_kernel_memory_usage_bytes","cgroupfs_tcp_memory_usage_bytes","cgroupfs_cpu_usage_us",
"cgroupfs_system_cpu_usage_us","cgroupfs_user_cpu_usage_us","cgroupfs_ioread_bytes",
"cgroupfs_iowrite_bytes","block_devices_used","container_cpu_usage_seconds_total",
"container_memory_working_set_bytes","block_devices_used"],"values":[[0,0,0,0,0,0,0,0,0,0,0,0,0,0,0],
[0,0,0,0,0,0,0,0,0,0,0,0,0,0,0]],"output_type":"DynComponentPower","system_features":["cpu_architecture"],
"system_values":["Broadwell"],"model_name":"","filter":""}
The request above will error with: {'powers': [], 'msg': 'fail to handle request: 16 columns passed, passed data had 15 columns'}.
For some reason block_devices_used appears twice in the headers. After some investigation, we just added a check that examines the length of the header array and eliminates the last occurrence of “block_devices_used”. This issue needs further investigation.
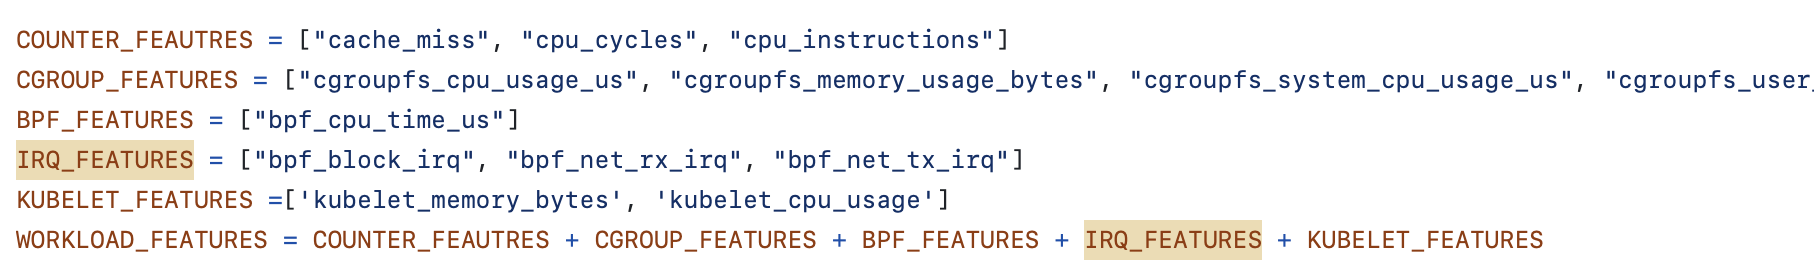
Issue 2: IRQ metrics naming convention
In the Kepler Estimator request, the IRQ metrics have irq- at the beginning: irq_net_tx, irq_net_rx, and irq_block. At the same time, in the Kepler Model Server, -irq is placed at the end of the name.
Compare:
- In Kepler Estimator:
"cpu_time","irq_net_tx","irq_net_rx","irq_block","cgroupfs_memory_usage_bytes"... - In Kepler model server:
This missmatch prevents the model server from returning a model, because of the missing features:
valid feature groups:  []
DynComponentPower
10.100.205.40 - - [18/Aug/2023 12:09:44] "POST /model HTTP/1.1" 400 -
To address the problem, an upstream issue was opened. The community was remarkably responsive, validating the problem and coming up with a fix.
Demo Time
Create some test load
After deploying Kepler and resolving the issues above, we can proceed and create some stress load using a tool called stress-ng. It is important to limit the memory the pod can utilize, to avoid other pods being killed.
apiVersion: v1
kind: Pod
metadata:
 name: stress-ng
 namespace: kepler
spec:
 containers:
  - name: stress-ng
    image: polinux/stress-ng
    command: ["sleep","inf"]
    resources:
      requests:
        memory: "1.2G"
      limits:
        memory: "1.2G"
Some commands that were utilized in the analysis:
stress-ng --cpu 4 --io 2 --vm 1 --vm-bytes 1G --timeout 30sstress-ng --disk 2 --timeout 60s --metrics-briefstress-ng --cpu 10 --io 2 --vm 10 --vm-bytes 1G --timeout 10m --metrics-brief
For more available parameters consult the relevant documentation.
Analyzing the Results
Access Grafana Kepler dashboard and monitor the metrics when creating the test load. We can clearly see the spikes in power consumption:
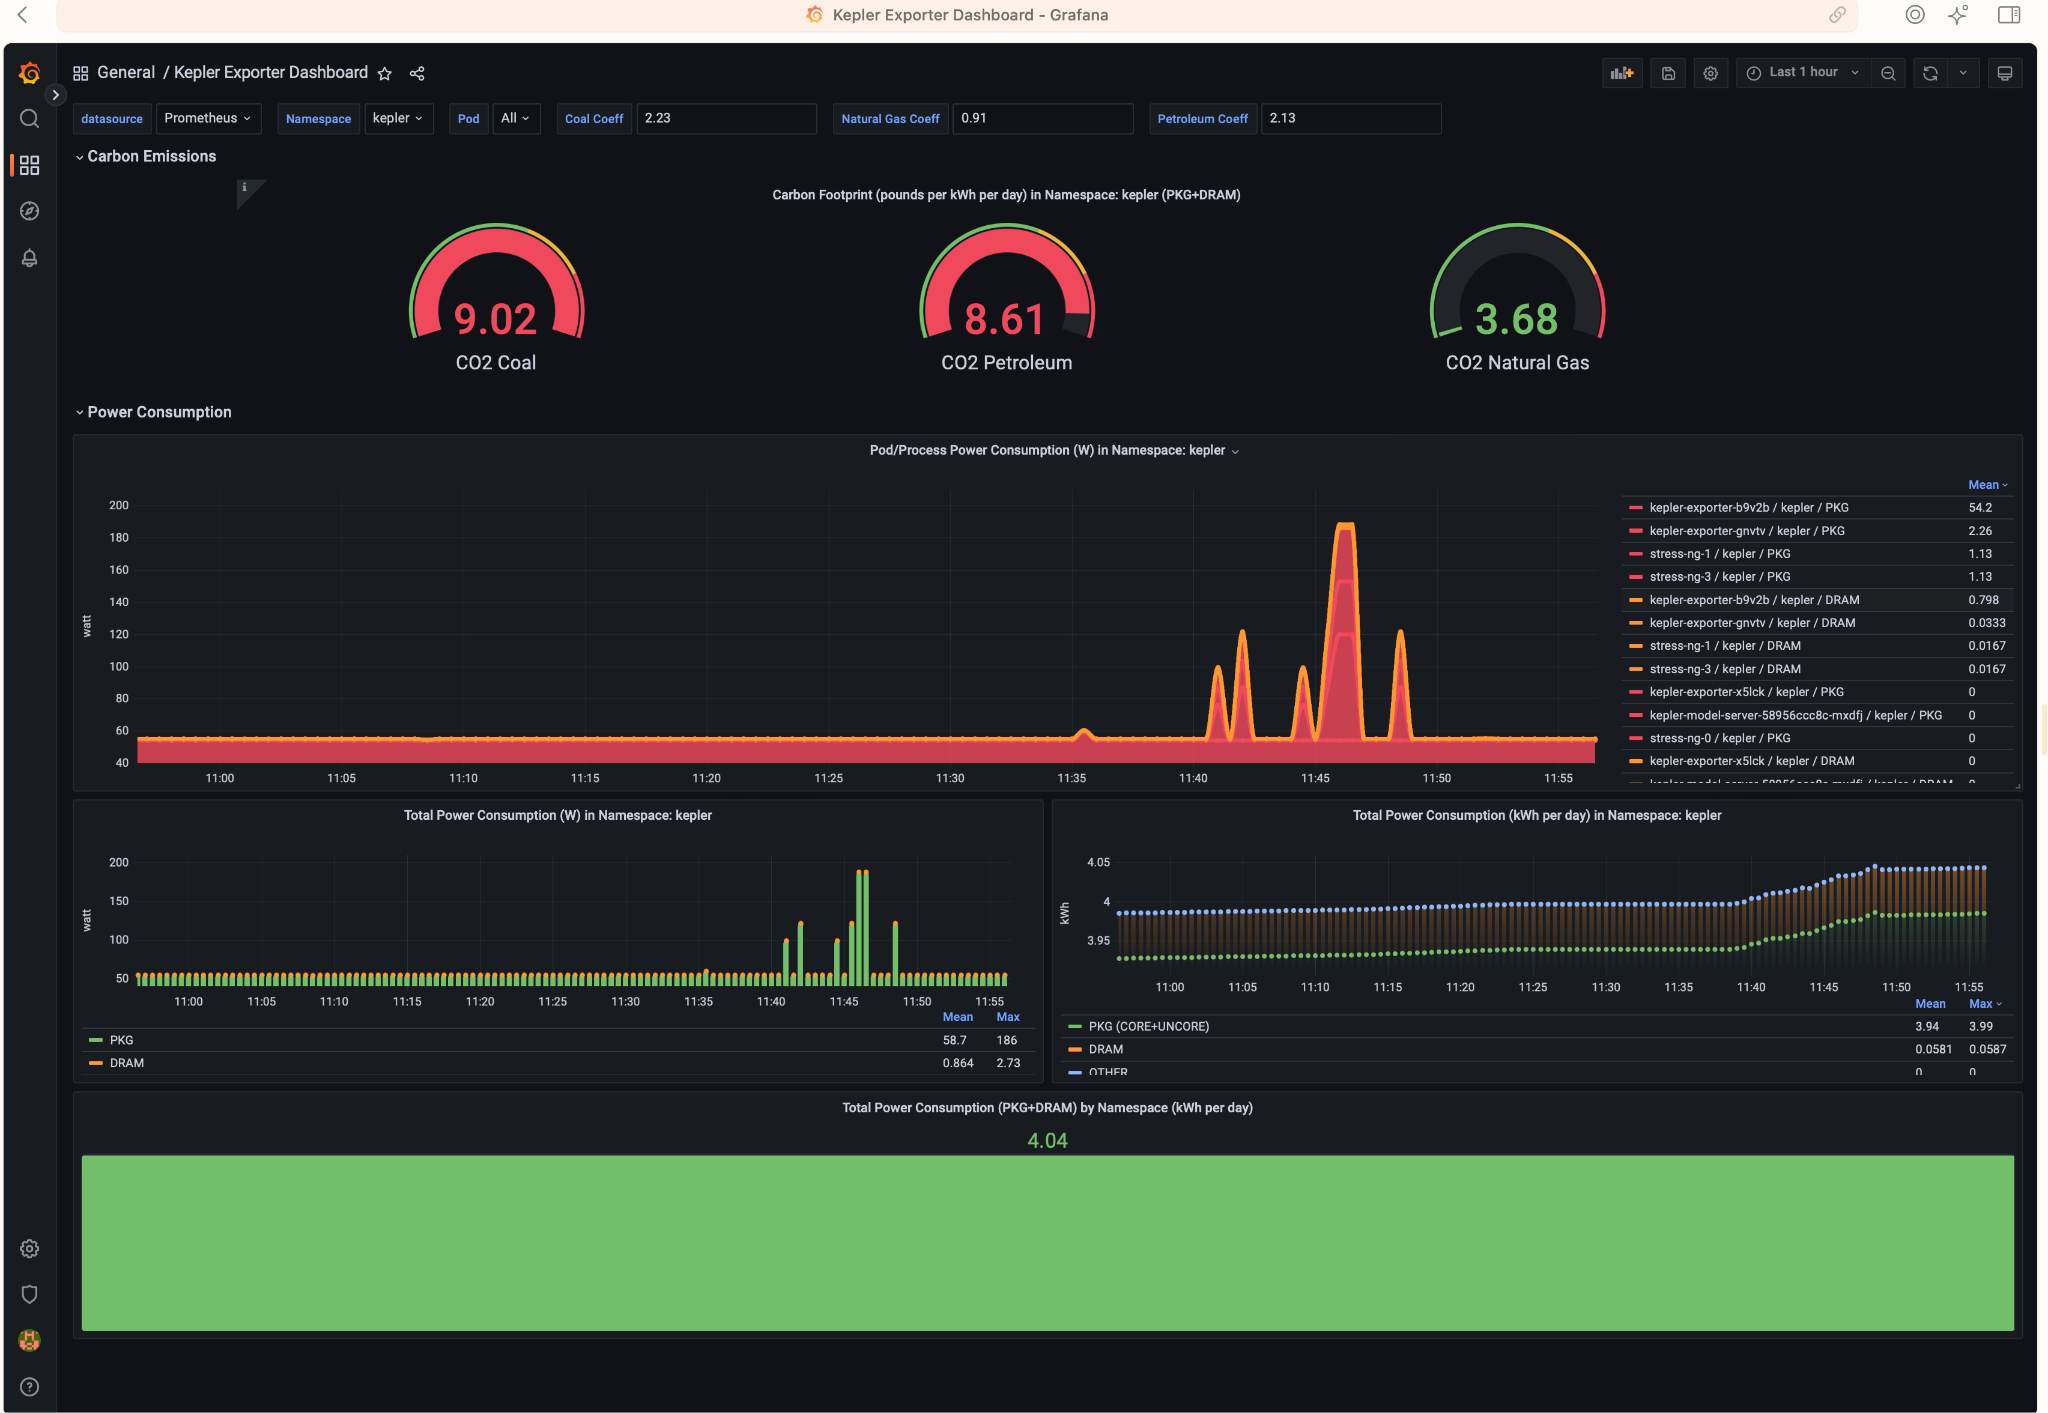
We can monitor the power consumption per process/pod. For example If we choose only the stress-ng pod:
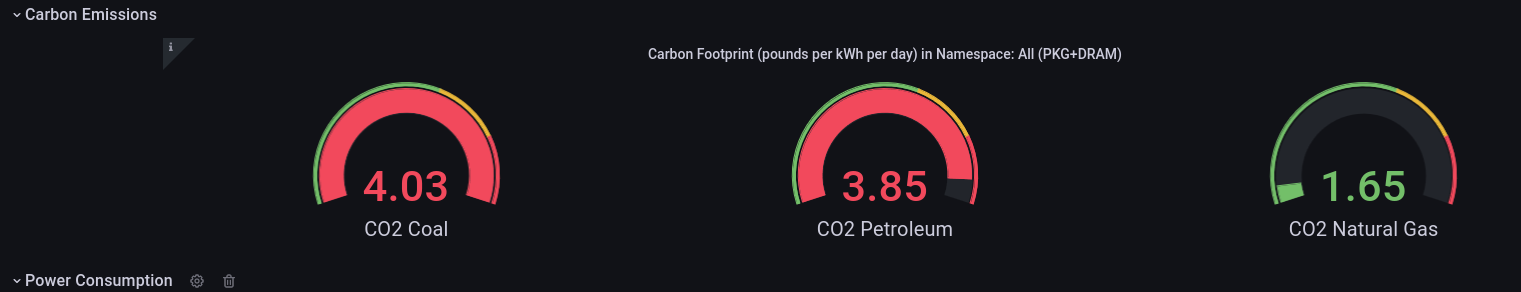
A panel worth to mention is “Carbon Footprint in Namespace”, where the metrics can be combined with power usage effectiveness (PUE) and electricity carbon intensity data to calculate the carbon footprint of the workload:
By observing resource utilisation and energy consumption at pod- and node- level we can better understand the environmental impact of a running Kubernetes cluster. Using data analysis we can make better decisions on how to allocate resources, optimize our workloads and architect our applications.
Conclusion and Future work
Engaging in a summer project focused on platform-aware scheduling using the Kepler library has proven to be a highly productive and valuable endeavor. This project has brought to light the substantial correlation between technology and environmental sustainability by exploring energy consumption metrics and carbon footprint data within Kubernetes clusters, both at the node and pod levels. Some future directions to take:
- To look into power aware scheduling:
While having fun, travelling, and making new friends at the same time…