Efficient Access to Shared GPU Resources: Part 2
This is part 2 of a series of blogposts about GPU concurrency mechanisms. In part 1 we focused on pros and cons and use cases for the different technology solutions available on Kubernetes.
This series focuses on NVIDIA cards, although similar mechanisms might be offered by other vendors.
Introduction
To extend cluster available resources, Kubernetes provides the device plugin framework. It allows specialized hardware to advertise itself to kubelet, without changing or customizing Kubernetes in any way. A high-level overview can be seen below:
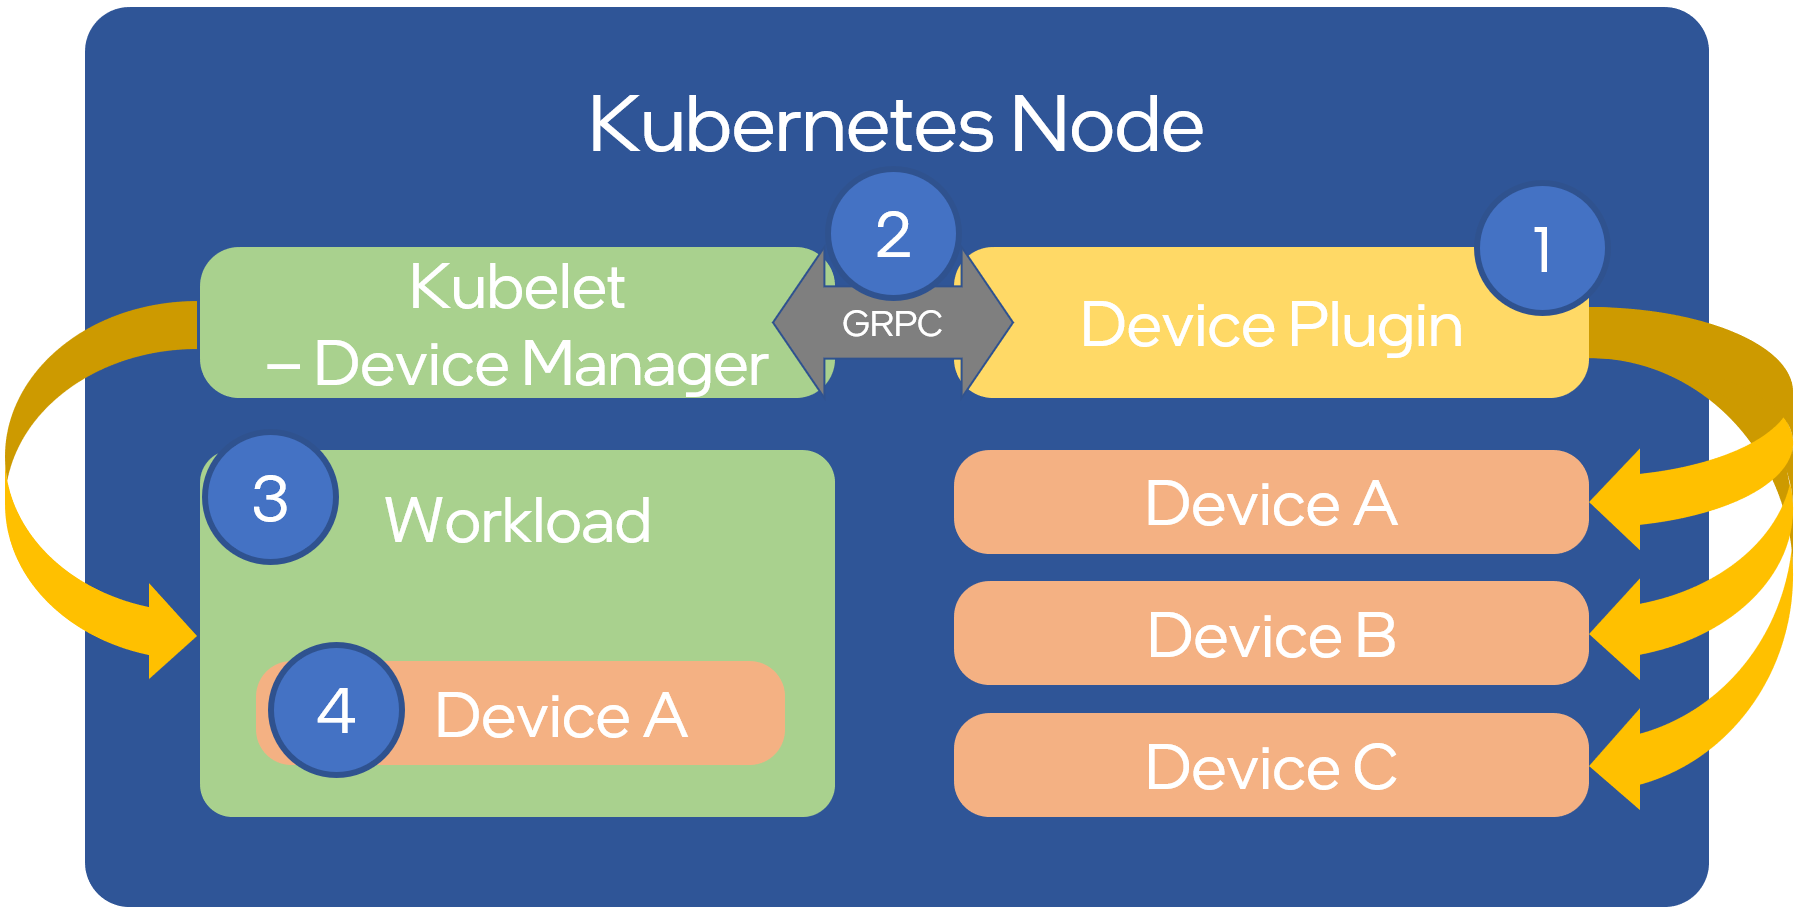
Source: OPNFV
However, configuring the nodes manually and managing them is hard. The administrator will have to deal with drivers, container runtimes, and a wide range of libraries. To simplify this task, NVIDIA provides a way to automate the management of NVIDIA resources and related software using the NVIDIA gpu-operator. This includes NVIDIA drivers, NVIDIA container runtime, Data Center GPU Manager (DCGM) for monitoring, etc. You can read more about this on NGC and GitHub.
Drivers Setup and Configuration
The gpu-operator provides a helm chart allowing basic installation and advanced setup of time-slicing and MIG. We will be doing this with hands-on practice, following each step along the way.
The operator tries to pull an existing container following format <driver>-<name>-<version_id> to install the driver - this must exist in the remote registry. You can check if a tag exists for the specific driver version and distribution you use with:
$ skopeo list-tags -- docker://nvcr.io/nvidia/driver | grep 510.47.03
        "510.47.03-centos7",
        "510.47.03-rhcos4.10",
        "510.47.03-rhcos4.9",
        "510.47.03-ubuntu18.04",
        "510.47.03-ubuntu20.04",
In our case we rely on FCOS which does not have an official image, but there is a fork available in this alternate repository. You can see other available NVIDIA driver version options by filtering the labels by the kernel version.
Armed with our dependent container images, lets install the gpu-operator chart on our cluster. First, add and update the helm chart repo:
$ helm repo add nvidia https://nvidia.github.io/gpu-operator
$ helm repo update nvidia
The gpu-operator appends to the driver image tag -fedora<VERSION_ID>, so we need to mirror the image into our registry. Do this:
$ skopeo copy docker://docker.io/fifofonix/driver:510.47.03-fedora35-5.16.13-200.fc35.x86_64 \
    docker://yourregistry/yourproject/driver:510.47.03-fedora35-5.16.13-200.fc35.x86_64-fedora35 --dest-username <user> --dest-password <password>
Let’s update the gpu-operator values.yaml configuration to meet our expected configuration options:
$ cat values.yaml
operator:
  defaultRuntime: containerd
mig:
  strategy: mixed
driver:
  repository: yourregistry/yourproject
  image: driver
  version: "510.47.03-fedora35-5.16.13-200.fc35.x86_64"
  imagePullPolicy: Always
migManager:
  config:
    name: nvidia-mig-config
devicePlugin:
  config:
    name: nvidia-time-slicing-config
Install with:
$ helm upgrade -i gpu-operator nvidia/gpu-operator --version v22.9.1 --values values.yaml --namespace kube-system
Both driver version and CUDA version can be set using the same values.yaml file provided above. If not explicitly set, the chart will use its own defaults. If setting the versions manually, make sure to check the CUDA Application Compatibility Support Matrix table to choose compatible driver/cuda versions.
To complete the installation, additional files that we will be using will also need to be added. We will explain in the next chapters what these are, but for now download the nvidia-time-slicing-config and nvidia-mig-config manifests and add them to your cluster:
$ kubectl apply -f nvidia-time-slicing-config.yaml
$ kubectl apply -f nvidia-mig-config.yaml
The gpu-operator components should now be installed:
$ kubectl get po -n kube-system
NAME                                                         READY   STATUS      RESTARTS        AGE
nvidia-container-toolkit-daemonset-cb7sj                     1/1     Running     0               3d16h
nvidia-cuda-validator-hkpw7                                  0/1     Completed   0               3d16h
nvidia-dcgm-exporter-vxtx8                                   1/1     Running     0               3d16h
nvidia-device-plugin-daemonset-7cqvs                         2/2     Running     0               2d18h
nvidia-device-plugin-validator-ndk54                         0/1     Completed   0               3d16h
nvidia-driver-daemonset-plzrb                                1/1     Running     0               3d16h
nvidia-hack-force-mig-config-46wrf                           1/1     Running     0               3d16h [1]
nvidia-mig-manager-4szxx                                     1/1     Running     0               3d16h
nvidia-operator-validator-d66nb                              1/1     Running     0               3d16h
[1] On some scenarios, it might be that k8s-device-plugin installation is failing. A workaround manifest is provided.
Time slicing setup on Kubernetes
In the previous post we introduced time slicing and its particularities. The gpu-operator brings a default configuration for the slicing profiles. Below we give an example to add custom profiles allowing GPUs to be shared between 4 or 10 pods. This is done by specifying that the resource of type nvidia.com/gpu is split into 4 or 10 replicas and can be shared among 4 or 10 pods:
apiVersion: v1
kind: ConfigMap
metadata:
  name: nvidia-time-slicing-config
  namespace: kube-system
data:
  slice-4: |-
    version: v1
    sharing:
      timeSlicing:
        renameByDefault: true
        failRequestsGreaterThanOne: true
        resources:
        - name: nvidia.com/gpu
          replicas: 4
  slice-10: |-
    version: v1
    sharing:
      timeSlicing:
        renameByDefault: true
        failRequestsGreaterThanOne: true
        resources:
        - name: nvidia.com/gpu
          replicas: 10
The configuration in the previous section already included the reference to this configmap.
Once you’ve updated the configuration, you can:
- Apply it to existing nodes with an explicit label:
$ kubectl label node <NAME> nvidia.com/device-plugin.config=<PROFILE>
- Set a default profile for every GPU node on your cluster, by passing it in the helm chart config:
devicePlugin:
  config:
    default: <PROFILE>
Let’s set now a time-slice profile on one of our nodes. Reconciliation should take 1 to 2 minutes:
$ kubectl label node <NAME> nvidia.com/device-plugin.config=slice-4
To verify the time sharing is enabled after labeling, use the kubectl describe node command. Check the GPU number in the allocatable resources section, it should have changed to 4 times the nodes physical available GPUs. With our time-slicing configuration the new resource will be appended .shared. So, on a node with 4 GPU cards:
Allocatable:
  nvidia.com/gpu: 4
Becomes:
Allocatable:
  nvidia.com/gpu.shared: 16
Test that the deployment is working as expected with a test manifest:
apiVersion: apps/v1
kind: ReplicaSet
metadata:
  name: nvidia-test-time-slice
  labels:
    app: nvidia-test
spec:
  replicas: 5
  selector:
    matchLabels:
      app: nvidia-test
  template:
    metadata:
      labels:
        app: nvidia-test
    spec:
      containers:
      - name: nvidia
        image: oguzpastirmaci/gpu-burn
        args:
        - "10000"
        resources:
          limits:
              nvidia.com/gpu.shared: 1
$ kubectl get po
NAMESPACE       NAME                                                         READY   STATUS      RESTARTS       AGE
default         nvidia-test-time-slice-2jxt2                                 1/1     Running     0              22s
default         nvidia-test-time-slice-gzxr5                                 1/1     Running     0              22s
default         nvidia-test-time-slice-kpwcn                                 1/1     Running     0              22s
default         nvidia-test-time-slice-vt265                                 1/1     Running     0              22s
default         nvidia-test-time-slice-wvpx4                                 1/1     Running     0              22s
…
The time slicing capabilities can be used together with MIG. Simply pass a MIG instance (for example nvidia.com/mig-1g.5gb) instead of the generic nvidia.com/gpu. The next section will cover the MIG setup.
Check the official Nvidia docs for most information on GPU time slicing.
Limiting Memory Usage
As described in part1, one of the major limitations of Time Slicing is the lack of memory isolation between GPU processes that run on the same card. This can be limited on some frameworks like Tensorflow but it depends on the users respecting declared resources.
To mitigate bad actors from interfering with other users GPU processes by starving the card out of memory (past the agreed maximum memory) we use a simple process that periodically watches and monitors the GPU process allocated memory and kills any outliers. This is similar to what Kubernetes does to control memory usage by pods.
Ensuring any running process on the GPU respects the agreed memory allows us to provide a more reliable environment for development workloads like notebooks or other typically spiky workloads, while improving overall usage and efficiency of individual cards.
Multi Instance GPU Setup on Kubernetes
In the previous post we introduced MIG, some of its particularities and use cases. In addition, when using MIG, there are multiple strategies available:
- single:
- MIG devices are enumerated as nvidia.com/gpu.
- The resource nvidia.com/gpu now maps to the MIG devices available on that node, instead of the full GPUs.
- mixed:
- Different resource types are enumerated for every MIG device available. Ex: nvidia.com/mig-3g.20gb, nvidia.com/mig-1g.5gb, etc.
- The partitions can be requested by name.
- mig.strategy should be set to mixed when MIG mode is not enabled on all GPUs on a node.
- none:
- No distinction between GPUs with MIG or without. The available devices are listed as nvidia.com/gpu resource type.
Similarly to the time-slicing configuration file, the gpu-operator brings a default configuration for the MIG profiles, but we will create one ourselves to allow some customizations - in this example we ignore things we do not consider useful (for example 7g.5gb). A snippet of our full configmap is described below:
apiVersion: v1
kind: ConfigMap
metadata:
  name: nvidia-mig-config
  namespace: kube-system
data:
  config.yaml: |
    version: v1
    mig-configs:
      disabled:
      - devices: all
        mig-enabled: false

      # A100-40GB
      2x2g.10gb-3x1g.5gb:
      - devices: all
        mig-enabled: true
        mig-devices:
          "1g.5gb": 3
          "2g.10gb": 2
A complete list of A100 GPUs MIG profiles can be found in the documentation, but not all configurations are exposed by us. Only the ones that optimize compute performance. This will be addressed in a future blogpost.
In the Drivers Setup and Configuration section, in values.yaml for the gpu-operator, the mig strategy was already set to mixed. So, the next step is to choose the profile for each node via a label:
$ kubectl label node <NAME> nvidia.com/mig.config=<PROFILE>
For example, if a node has 4 A100 GPUs available, and is labeled with nvidia.com/mig.config=7x1g.5gb all GPUs in that node will be partitioned into 7 MIG graphical instances. Depending on the type of strategy selected on the node, the allocatable.resources publicized by that node will be:
- for single strategy: 4*7 = 28
nvidia.com/gpu - for mixed strategy: 4*7 = 28
nvidia.com/mig-1g.5gb
More information can be found in the GPU operator and MIG user guide upstream documentation.
Here’s an example setting the 2x2g.10gb-3x1g.5gb MIG profile to one node:
$ kubectl label node <NAME> nvidia.com/mig.config=2x2g.10gb-3x1g.5gb
So, on a node with 4 GPU cards:
Allocatable:
  nvidia.com/gpu: 4
Becomes:
Allocatable:
  nvidia.com/mig-1g.5gb: 12
  nvidia.com/mig-2g.10gb: 8
Test that the deployment is working as expected with a test manifest:
apiVersion: apps/v1
kind: ReplicaSet
metadata:
  name: nvidia-test-mig-a100
  labels:
    app: nvidia-test
spec:
  replicas: 4
  selector:
    matchLabels:
      app: nvidia-test
  template:
    metadata:
      labels:
        app: nvidia-test
    spec:
      containers:
      - name: nvidia
        image: oguzpastirmaci/gpu-burn
        args:
        - "10000"
        resources:
          limits:
              nvidia.com/mig-2g.10gb: 1
$ kubectl get po
NAME                          READY   STATUS    RESTARTS   AGE
nvidia-test-mig-a100-bw95c    1/1     Running   0          78s
nvidia-test-mig-a100-drxg5    1/1     Running   0          78s
nvidia-test-mig-a100-kk5wb    1/1     Running   0          78s
nvidia-test-mig-a100-n9mbr    1/1     Running   0          78s
Monitoring your cluster
With a variety of GPU Cards and different working mechanisms that can be used, it is important to keep track of the resource usage to know if the resources are not idling when otherwise they can be re-assigned.
Using the gpu-operator and enabling monitoring with prometheus by using the kube-prometheus-stack helm chart you can collect the metrics made available by the NVIDIA DCGM exporter. Internally we created a dashboard to showcase resource usage on clusters supporting heterogeneous nodes and different mechanisms. You can find it in the upstream grafana dashboards repository.
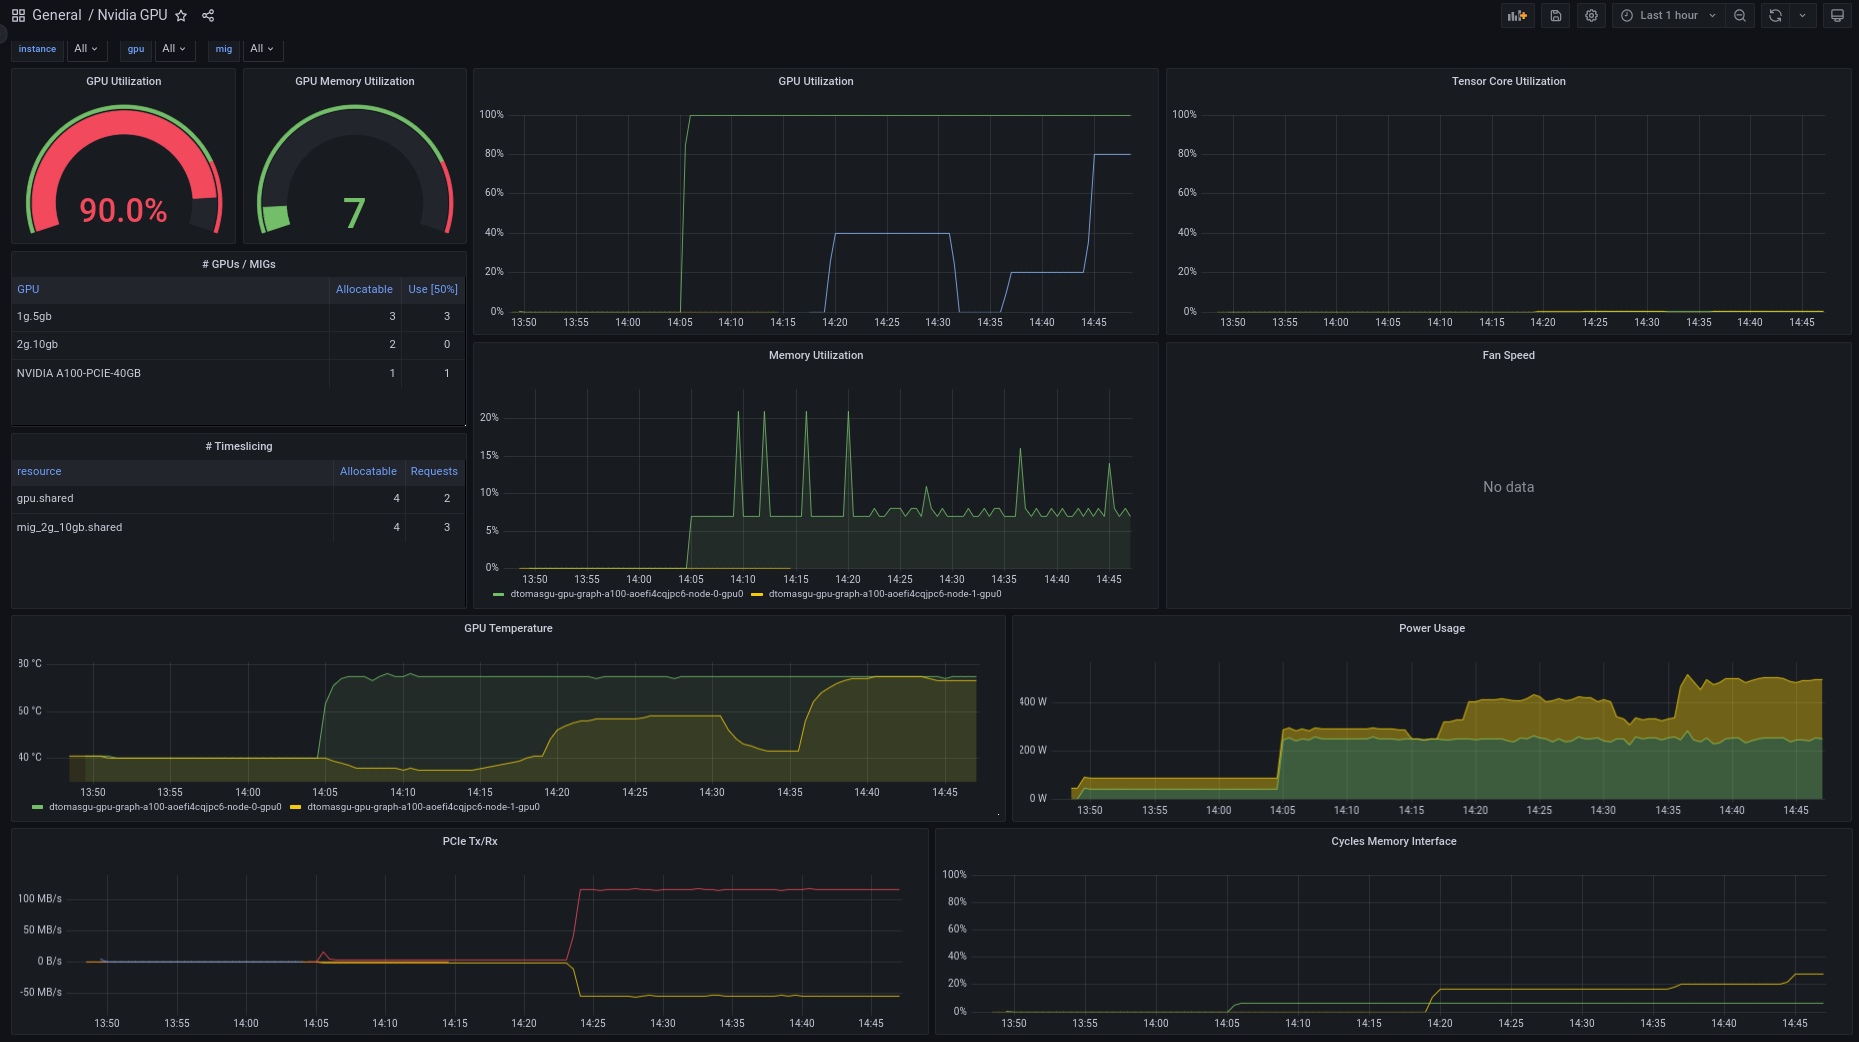
Source: CERN
While CUDA cores are designed for general-purpose parallel computing, Tensor cores are specialized for deep learning and AI. As a result, not all workloads will benefit from them. In this context, to make sure the GPU is fully utilized, it is a good idea to have more granular cores utilization monitoring, as presented in the image below:
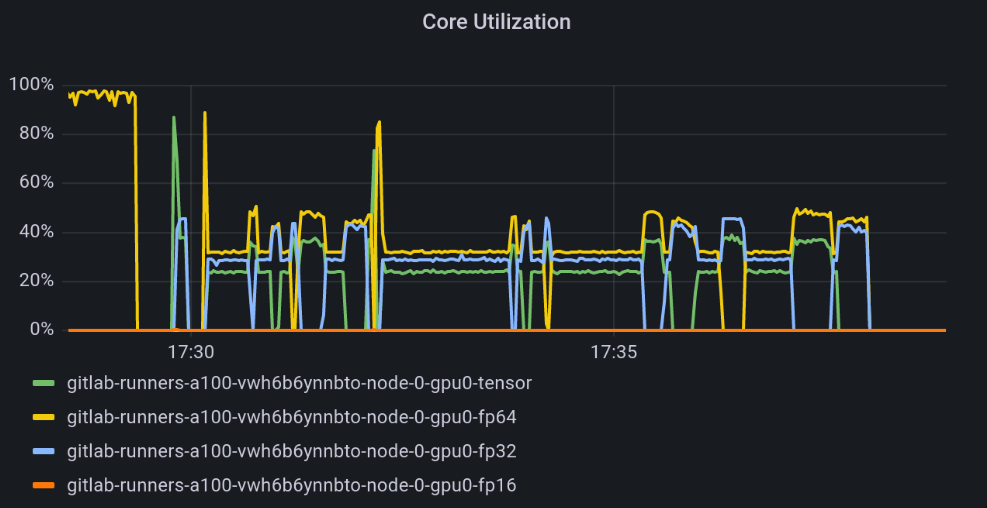
Source: CERN
Conclusions
As you could see, installing and configuring your Kubernetes cluster to be able to use NVIDIA GPU’s is quite simple due to the usage of the NVIDIA provided gpu-operator helm chart. Some details need to be taken into account due to the underlying host kernel and OS being used so that the compatible kernel modules can be used/compiled.
In this section we have shown how to use time-slicing and MIG configuration on the cluster nodes. For more advanced deployments the cluster administrator can also configure time-slicing on top of MIG GPU instances, but this was not demonstrated here.
Because we are labeling each node individually we can have coexistence of different configurations - full card, time-slice and MIG - in a single cluster. This is useful if we have a cluster with heterogeneous card types (T4, A100, …) and we want to accommodate different profiles to optimize cluster resource usage.
Next Episode
With the configurations provided in this blog post we’re ready to test our deployments. In the next blog post we will provide performance benchmarks using different configurations and profiles. Stay tuned!