Efficient Access to Shared GPU Resources: Part 3
This is part 3 of a series of blog posts about GPU concurrency mechanisms. In part 1 we focused on the pros and cons of different solutions available on Kubernetes, and in part 2 we dove into the setup and configuration details.
This series focuses on NVIDIA cards, although similar mechanisms might be offered by other vendors.
Introduction
GPU hardware specifications are very useful to estimate how fast a program can be executed, how much power it will consume, or which device is more suitable for different types of workloads. Still, it is very important to benchmark the GPUs and make sure the theoretical conclusions are supported by practical experiments. This can help find pain points that are best addressed sooner rather than later.
In this context, we decided to benchmark the GPUs with different loads, inspired by some of our core use cases:
- FLOPS Counting
- Compute-Intensive Particle Simulations
- Machine Learning Training
FLOPS Counting
Floating Point Operations Per Second (FLOPS) is the main metric used to show how powerful a GPU is when working with different data formats.
But counting FLOPS can be hard! Instead of writing our own code multiplying matrices we’ll be using dcgmproftester which handles all the complexity for us.
dcgmproftester is a CUDA-based test load generator from NVIDIA. The script is easy to use and creates loads that give a 90+% GPU usage, making it suitable for benchmarking. It is shipped as a binary along CUDA Kernels.
There are multiple options for using dcgmproftester:
- On Kubernetes, NVIDIA DCGM is provided as a part of NVIDIA GPU Operator installation. This is the option used in this blog post series.
- Use the dcgm images, see the available tags.
- It is not recommended to use the dcgmproftester images available as part of nvidia samples on docker hub. These images are not supported anymore.
The command dcgmproftester receives a few arguments:
-tto specify the profiling fieldId. See the full list of profiling identifiers. For benchmarking we use:- ID 1008 for fp16 profiling
- ID 1007 for fp32 profiling
- ID 1006 for fp64 profiling
- ID 1004 for Tensor Cores profiling
-dto specify the duration in seconds-ito specify the id of the GPU to run on--no-dcgm-validationto let dcgmproftester generate test loads only
For example, to benchmark the fp32 performance on the GPU with id 0 during 50 seconds use the following command:
/usr/bin/dcgmproftester11 --no-dcgm-validation -t 1007 -d 50 -i 0
Compute-Intensive Particle Simulations
A big computational load at CERN is dedicated to simulations. Those are compute-intensive operations that can benefit a lot from GPU usage.
For this benchmarking, the simpletrack LHC simulation is used, available from this repo.
To replicate the experiments:
- Use the image
gitlab-registry.cern.ch/hep-benchmarks/hep-workloads-gpu/simpletrack/nvidia:latest - The simulation script is located at
simpletrack/examples/lhc/ - Run the simulation using:
./lhc-simpletrack.sh -p <number_of_particles> - Use
/usr/bin/time(instead of time) to time the execution.
Machine Learning Training
The benchmarking is performed based on a Transformers tutorial, using a pre-trained model (bert-base-cased) and fine-tuning it with PyTorch. The script is benchmarked using nvcr.io/nvidia/pytorch:22.10-py3 image.
Things to keep in mind while benchmarking:
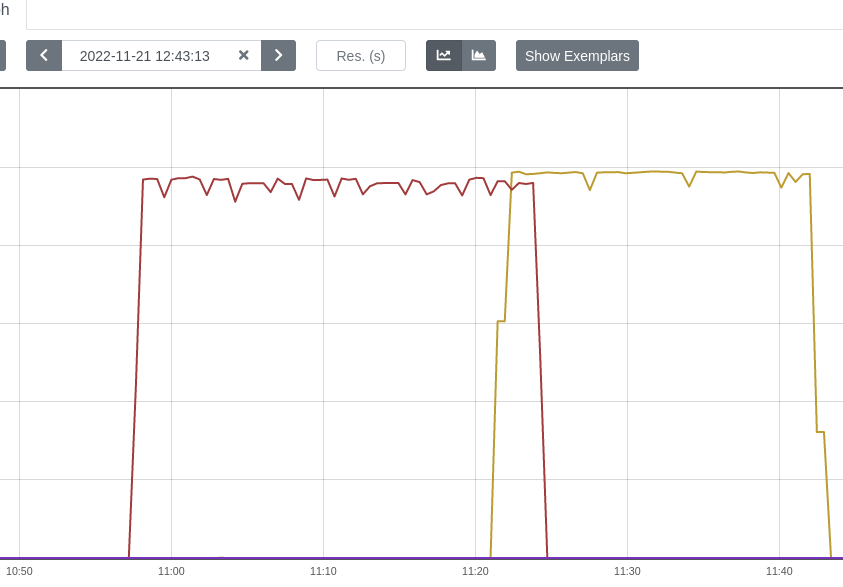
- Make sure the benchmarking is not CPU-bound. Initially, the model was trained with a single data loader worker and as a result, the GPU was utilized 88-96%. When having multiple worker processes, the GPU utilization was much more stable - about 98% with just a few spikes of 95% (the spikes are related to the number of epochs used).
- Increase the batch size based on the amount of memory available. Try powers of 2 until getting an OOM error. 24/48 batch sizes also can work.
The points above contributed to a less spiky GPU utilization which is very important for benchmarking. See the difference below (the spikes are related to the number of epochs, in this case 3):
Some other ideas on how to improve GPU utilization:
- Use a smarter dataloader. For example
FFCVloader, but there are many other alternatives. - Use a good profiler to understand what model operations are the most expensive, what is the active CPU time/active GPU time etc. A good starting point is
torch.profiler. Also, one can decide to visualize the profiled operators and CUDA kernels in Chrome trace viewer, to detect performance bottlenecks of the model:
from torch.profiler import profile, ProfilerActivity

with profile(activities=[ProfilerActivity.CPU, ProfilerActivity.CUDA]) as prof:
    trainer.train()

print(prof.key_averages().table(sort_by="cpu_time_total", row_limit=10))
prof.export_chrome_trace("trace.json")
This snippet will export the profiled data into trace.json. Open the generated file with chrome://tracing/ to go into more details about the running processes:
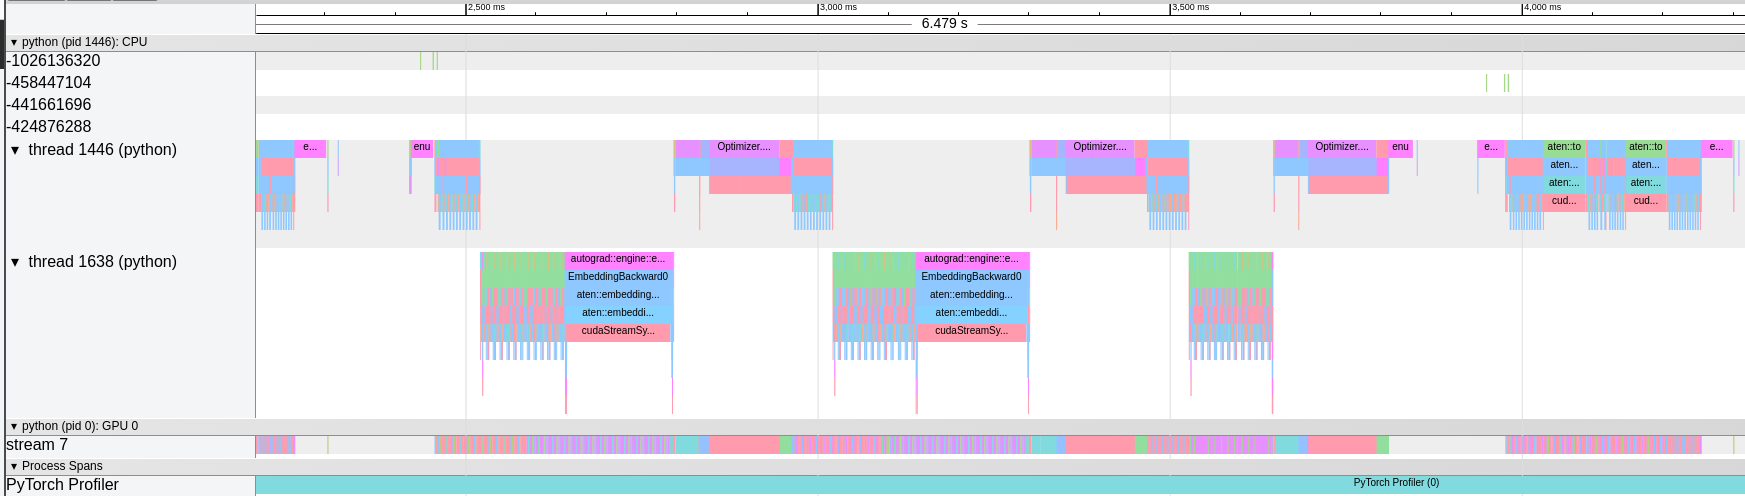
Chrome trace viewer
Environment Setup
The benchmarking is performed exclusively on NVIDIA A100 40GB PCIe GPUs.
For maximum reproducibility, see the exact versions of software used for benchmarking:
- Kubernetes: 1.22
- Container runtime: containerd://1.4.13
- Kubectl: 1.25
- Cuda version utilized: 11.6
- Prometheus: prometheus:v2.28.1
- DCGM image tag: dcgm-exporter:2.4.5-2.6.7-ubuntu20.04
- Node OS image: Fedora CoreOS 35.20220227.2.1
- Node Kernel Version: 5.16.13-200.fc35.x86_64
- Driver Version: 470.129.06
Good to know
NVIDIA System Management Interface (nvidia-smi) is a very handy command line utility to check GPU stats. One nice feature is that it shows what processes are using the GPUs. But this will not work in a containerized setup. nvidia-smi is not compatible with PID namespaces, and as a result will not be able to list the running processes. Compare the outputs:
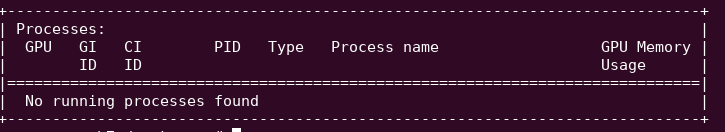
Output when the GPU is not used, explicitly saying there no running processes.
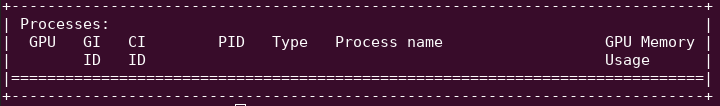
Output when there is at least a process in a container using the GPU. The section is left empty.
Next episode
In the next blog post, we will dive into the extensive time-slicing benchmarking. Stay tuned!